S&P 500 Breaks to New Highs — Legs, Breakouts, and What's Next
The S&P 500 broke to new highs this past week. Here's what the chart is telling us about market structure, the concept of price legs, and the setups we're watching closely.
The S&P 500 broke to new highs this past week. It was a good week for most markets with few exceptions.
This is a beautiful chart of the S&P 500 illustrating how markets sometimes simply take a breather by going sideways rather than falling. It also clearly shows how prices move in legs, or waves.
This is important because it gives us a framework. For example, you could buy under the premise that we will see another leg to the upside. This makes decisions to buy and sell much easier — because if you know your premise to buy and what you believe it will look like, if it doesn't start panning out how you thought it would, you can simply sell and move on to the next idea.
The chart of the S&P 500 shows the leg up from 1 to 2, and the sideways resting price action from 2 to 3.
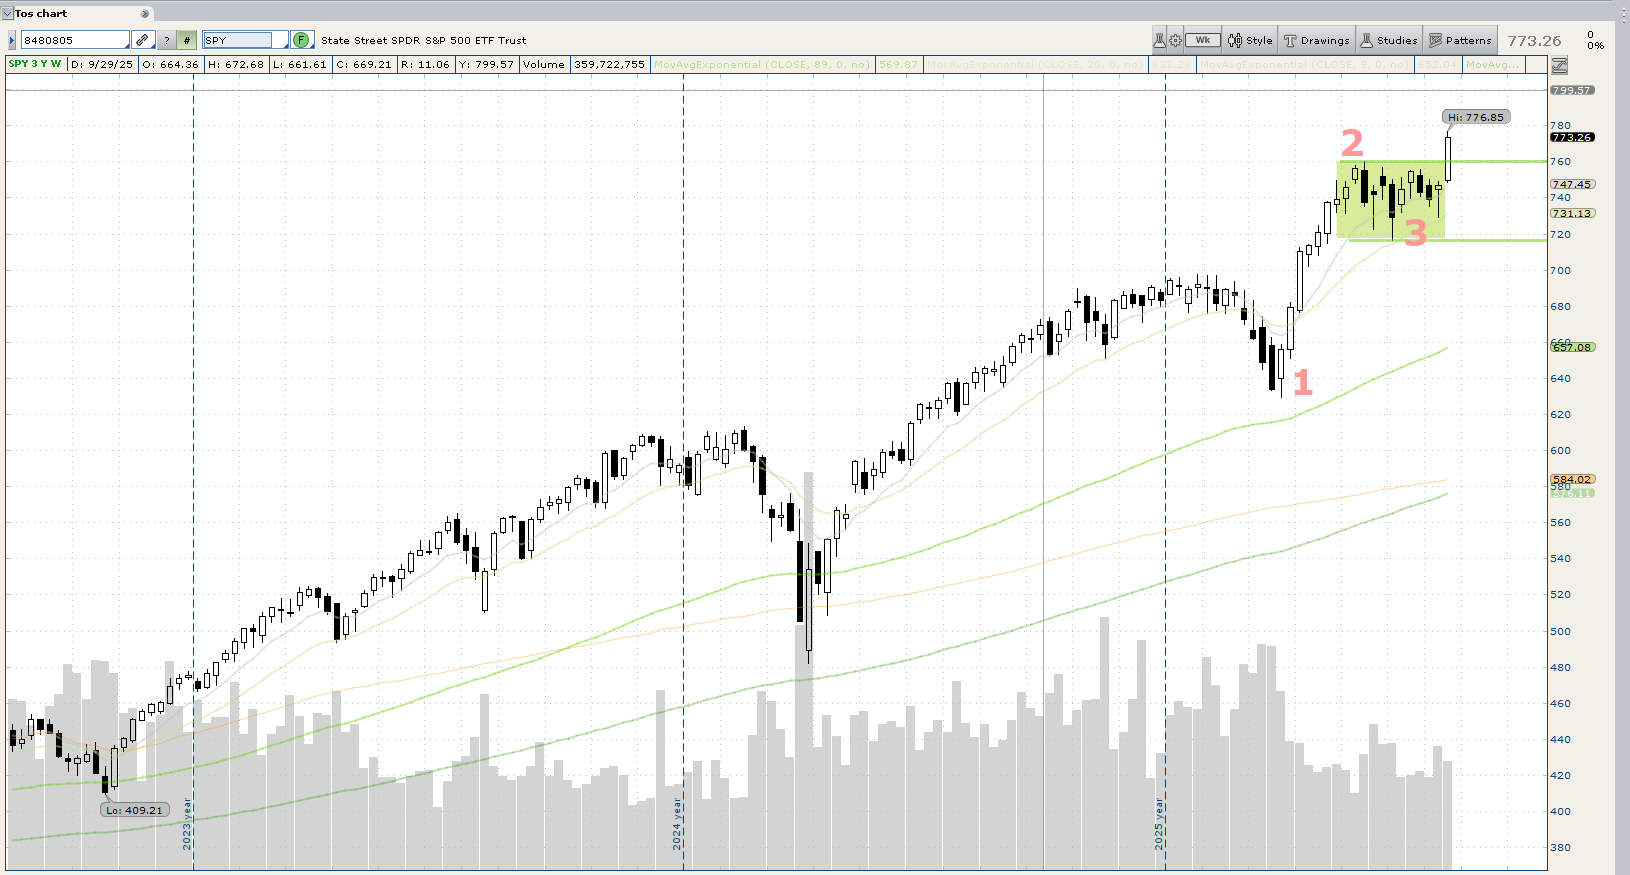
This is bullish price action for the S&P 500 and now the bulls want to see another high this week. If the S&P 500 quickly fails this week, it could mean a much deeper pullback — as it would trap the longs that just purchased the breakout.
New Positions Added Last Week
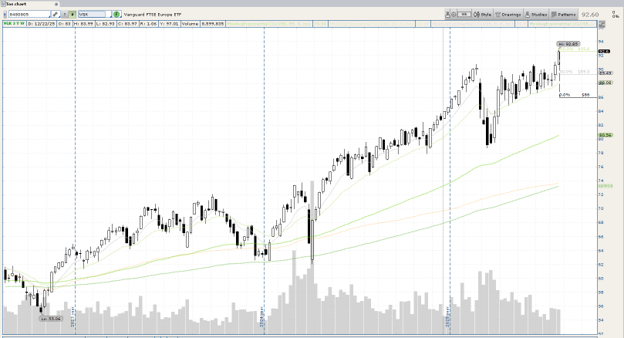
Last week we purchased a couple of new positions. VGK triggered our buy signal as well as AOD. The chart of VGK shows the area where we would stop out if the trade goes against us.
Setups to Watch This Week
For this week, we have two setting up nicely for buy triggers: DIV and ARKF.
ARKF fits into our breakout setup relatively nicely — sideways price action for many months, held above the longer-term weekly moving averages, and it has tried many times to break to the downside without success. If it doesn't do one thing… it will do the opposite!
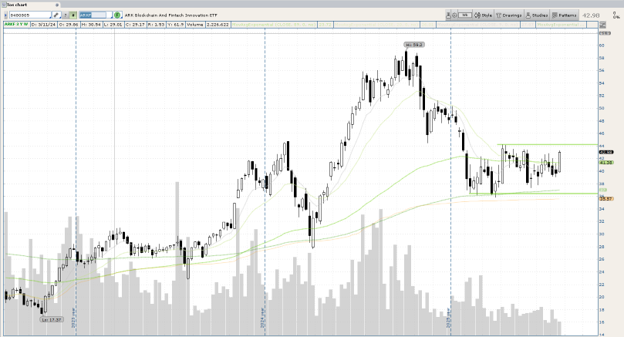
We will be watching both closely to see if they trigger. If they do, we will surely buy with available capital.
Overall Market Health
Overall the markets and positions look healthy at this point. Bonds are coming off their respective bottoms and financing companies are also coming off of their lows. The more conservative sectors — such as utilities and staples — are also lagging, showing a more aggressive appetite for risk.
Of course, all of this can change in a blink of an eye, and that is the entire reason for using stop losses. We will surely be paying close attention and acting accordingly!
13 Core Investment Principles

Written by
Adam Straseske, CMT
Content creator and writer sharing insights and stories.